
Cyclone Nisarga had made its impact in the state of Maharashtra on the 3rd of June with the wind speed of 90–100 kph. Less than a month back, Cyclone Amphan had made its presence in the eastern part of India on 20th May with the wind speed of 260 kph (Though, till the time it entered India, wind speed reduced to 150–160kph).
Having said that, we are already battling with one of the worst pandemics viz. Coronavirus since the start of the year 2020.
There is a meme rolling around which claims that we have seen it all in the year 2020. Virus attack, Cyclones, Earthquakes, Locust attack. What’s more to come?
Is the year 2020 doomed? Is this one of the worst years of all time? Or, is it just the beginning? Well, let’s not speculate.
But one thing is clear. This year has brought us to understand the seriousness of the dreadful impact that nature can bring if we are not serious in taking care of it, hasn’t it?
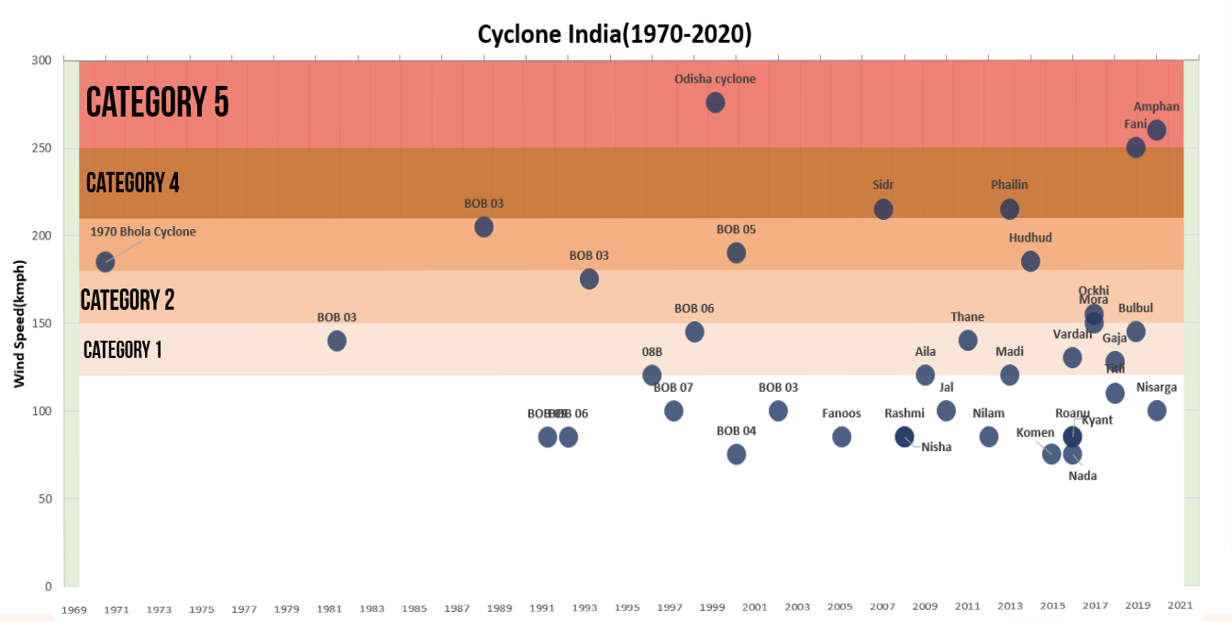
The graph above details the Cyclones which impacted India over the period from 1970 to 2020. We are seeing an increasing number of clusters forming post-2005, though the majority of the cyclones had wind speed less than 120 kph (Minimal Damage Capacity).
There is an almost 85% increase in the number of cyclones from the period 1970–2004 to the period 2005–2020. However, there is also a growing number of cyclones from Category 3, 4, and 5 (wind speed greater than 180kph), which are more destructive and intense.
Taking
the case of Cyclone Fani, which originated in the year 2019 impacting the
eastern parts of India, Bangladesh, and Sri Lanka. It had a wind speed of
250kph (Category 4). Total fatalities are estimated to be 89 and economic
damage of $8.1 billion (USD). (Source: wikipedia)
According to the report, there will be a further 28% increase (from present-time to the late 21st century) in the number of Cyclones of Category 4 and 5.
Let’s not limit ourselves to India and cyclones for that matter. Natural disasters are becoming more intense and more frequent around the globe.
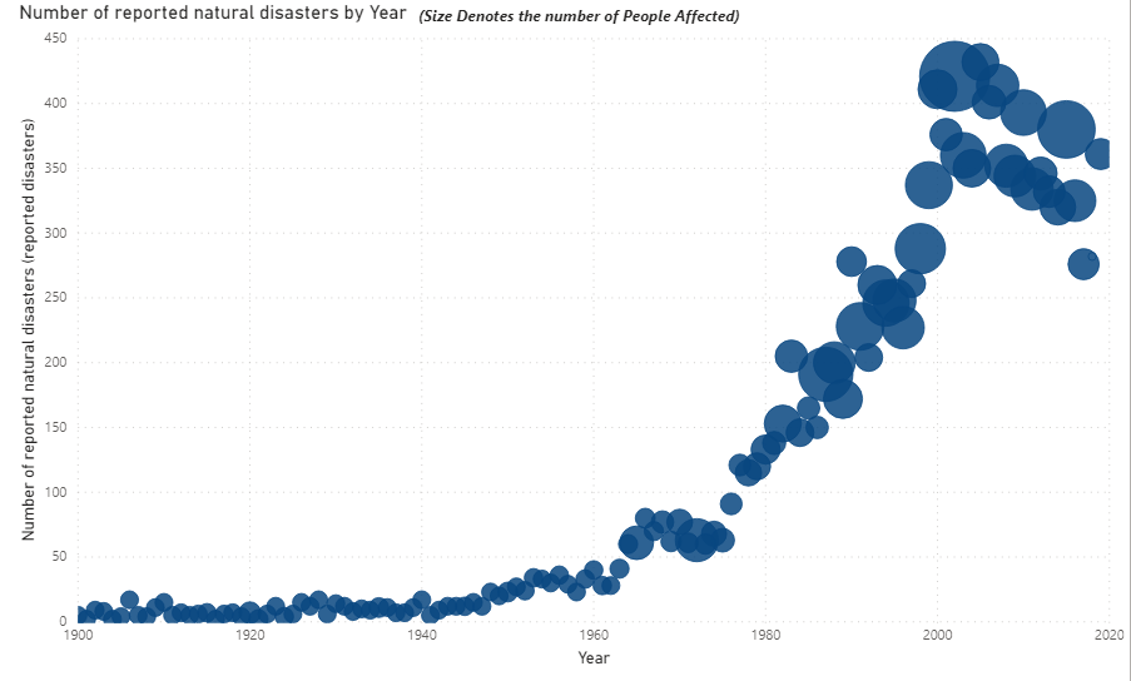
The graph above reveals the trends. It shows the reported number of Natural Disaster (This includes drought, floods, extreme weather, extreme temperature, landslides, dry mass movements, wildfires, volcanic activity, and earthquakes.) around the globe from 1900 to 2019. The size of the bubble is proportionate to the number of people affected.
The graph below gives us the idea of economic
damage (USD) caused due to reported natural disasters around the globe from the
year 1960 to 2018.
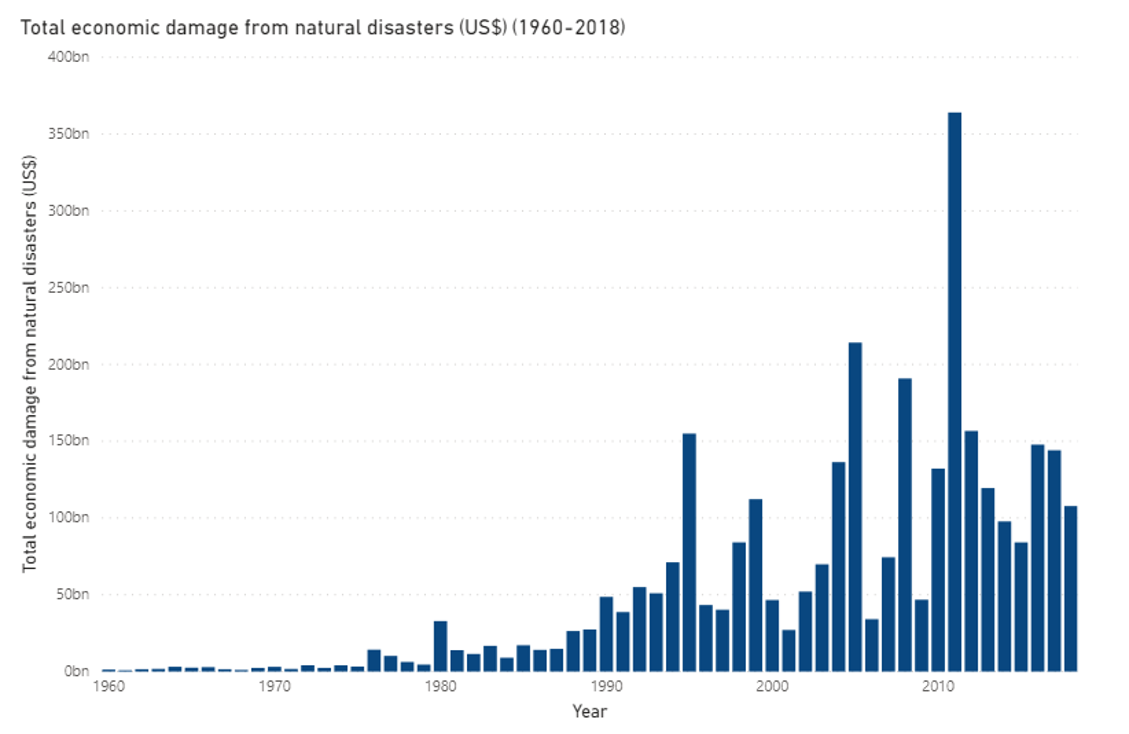
It’s clear that the environmental issues we face are beginning to have a larger real impact on the globe socially as well as economically.
Well, environmental issues are not only limited to natural disasters. There is also biodiversity loss, water scarcity, an increase in sea level, loss of coral reef, etc.
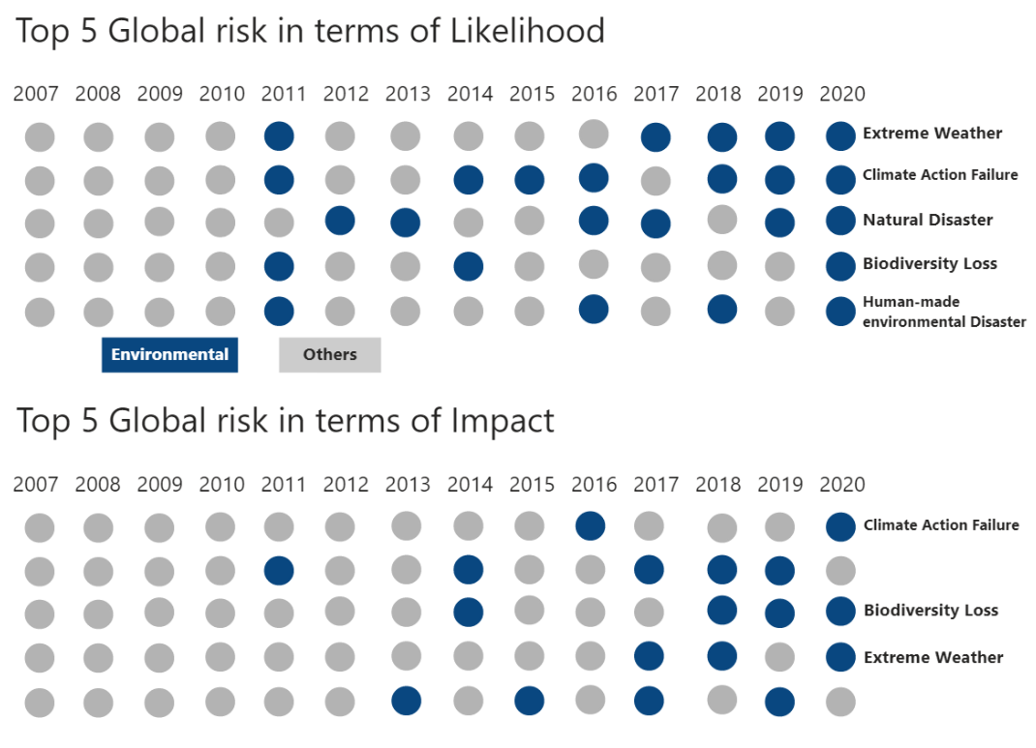
For the first time in the history of the Global
Risks Perception Survey conducted by WEF, environmental concerns dominated the
top 5 long-term global risks by likelihood in the year 2020. Whereas, three out
of the top 5 global risks by Impact also belonged to environmental issues. (refer Graph below)
The reason, you may ask? The chief reason is Global warming which is due to an increase in the rate of Greenhouse gas emissions over time.
The last five years are on track to be the warmest on record.
As seen in the graph below, the global average temperature is close to 1°C above pre-industrial levels.
The pre-industrial period refers to the period from 1850 to 1900, during which the Industrial Revolution was in full swing, jumpstarting climate change.
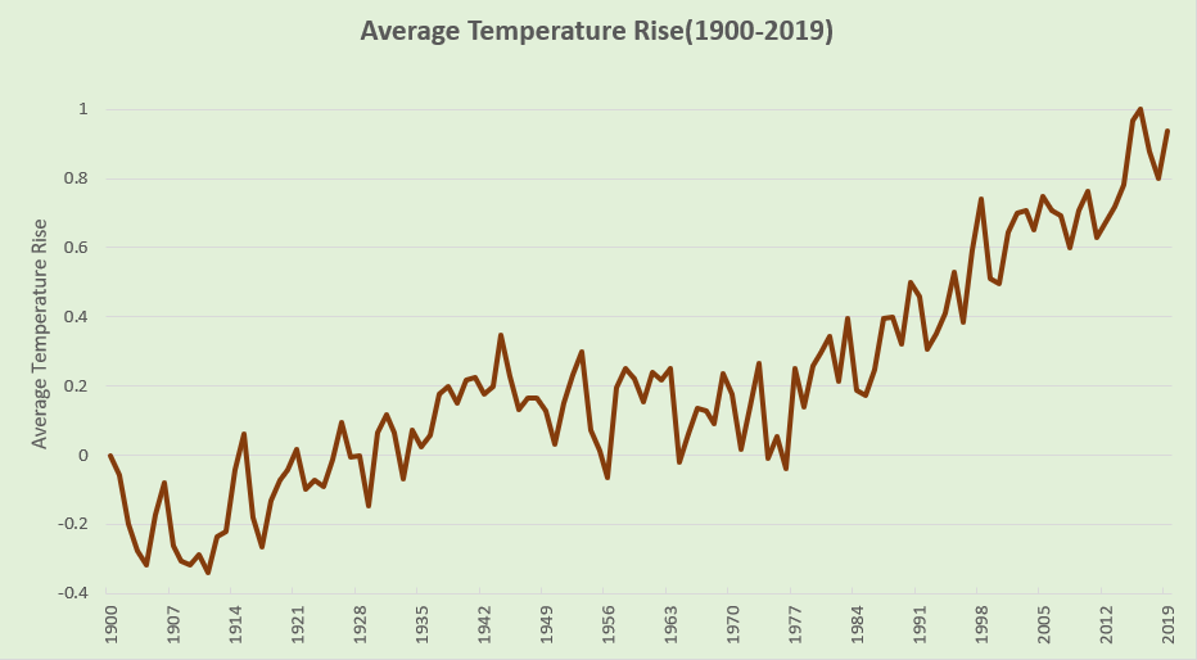
If we follow the current trajectory, the average temperature will rise to at least 3°C by the end of the century.
Some might say, “Hey, it’s just 3°C, why to worry much. I am experiencing a daily fluctuation in temperature by 3°C, it doesn’t make a lot of difference to me.”
To be clear, we are not talking about the daily increase in temperature but 'Global Average Temperature Rise' and it does make a lot of difference. Believe me. (For more details, please refer the report)
Whereas in order to avoid the most severe economic, social, and environmental consequences, climate experts warned that the temperature rise must be limited to 1.5°C by the end of the century.
According to the report from IPCC (Well, it’s a very long and exhausting report. Read at your own will), going from 1.5°C to 2°C will lead to:
- 1.7 billion more people will experience severe heatwaves at least once every five years.
- The global mean sea level will rise from 0.77m to 0.1m. A difference of 0.1 m may correspond to almost 10 million people exposed to climate-related risks and poverty
- Coral reefs (that supports marine environment) are projected to decline by a further 70–90% at 1.5 °C, and even more than 99% at 2 °C.
- Global fishery catches could decline by another 1.5 million tonnes.
- Crop yields will likely drop in many regions, undermining the ability to double food production by 2050 to meet rising demand.
(Source: Wikipedia; The Climate Reality Project. Definitely, I haven’t read the entire IPCC report)
The results will be even worse for the rise of 3°C.
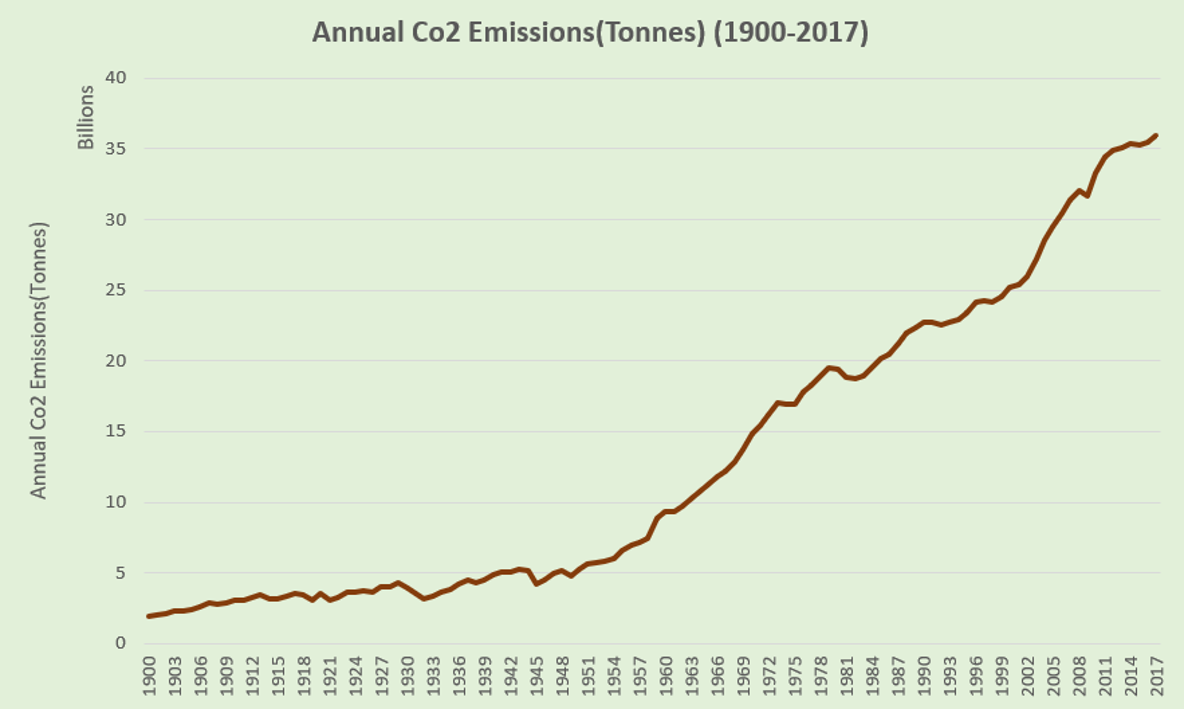
Limiting the temperature increase is to limit Greenhouse gas emissions.
The graph below gives an account of annual Carbon-dioxide gas (Chief contributor to Green-house gases) emissions over a period of time.
Carbon
dioxide is not the only greenhouse gas. There are a range of greenhouse gases,
which include methane, nitrous oxide, and a range of smaller concentration
trace gases such as the so-called group of ‘F-gases’.
According to the IPCC report, in order to limit global warming to below 1.5°C, CO2 emission will need to fall by 45% from 2010 level by the year 2030, and by 100% by 2050.
Even just for limiting global warming to below 2
°C, CO2 emissions should decline by 25% by 2030 and by 100% by 2070. (Source: Wikipedia)
This can be achieved by employing various measures.
Let me list down some:
- Shifting to low- or zero-emission power generation, such as renewables.
- Changing food systems and diets. (Yes, you heard it right. Food accounts for 10–30% of the household’s carbon footprint. Out of which, meat contributes to a larger share of 57%. Source.)
- Improving energy efficiency by smart urban planning.
- An increase of forest cover by 10,000,000 square km by 2050 relative to 2010.
- Electrifying transport and developing ‘green infrastructure’.
Nonetheless, achieving significant change will require a greater commitment from Governments and Businesses alike.
Paris Agreement (2015) was indeed a steppingstone in creating an
environmental accord that was adopted by nearly every nation to address climate
change and its negative impacts.
However, the recent COP25 summit (the UN climate change conference) in the year 2019 was a major setback as the nations were unable to reach a consensus in many areas concerning climate change and they also failed to develop a rule book for a new global carbon market.
UN Secretary-General Antonio Guterres said, “the international community lost an important opportunity to show increased ambition on mitigation, adaptation & finance to tackle the climate crisis.”
The only positive thing which resulted from the COP25 summit was the emergence of Greta Thunberg. (Just kidding)
To sum it up, climate change is real and one of the most pressing issues in today’s time. As Barack Obama once said, “there’s one issue that will define the contours of this century more dramatically than any other, and that is the urgent and growing threat of a changing climate.” The steps taken today will decide the outcome for the future.
So, is the year 2020 really doomed? Or, is it just the beginning?
PS: World Environment Day was celebrated on the 5th of June. So, have you done your bit to protect the environment? On a personal level, we could also pledge to make a difference by employing little things. Maybe by limiting the use of plastics, avoiding the use of personal transport wherever possible (walking and cycling are also best for the health), stop littering and using dustbin, deleting SPAM mails.
FunFact:
Ever wonder the mails you sent and the mails you receive can be linked-to
carbon emission? Well, you heard it right. The carbon footprint linked to a
normal mail is approx 0.3g CO2e (Carbon dioxide equivalent). It can rise to 50g
CO2e with the addition of large attachment.(Source)
So, make sure you delete your emails at regular intervals and also be cautious of sending unnecessary emails.
___________________________________________________________________
Reference:
- Wikipedia
- Our World in Data: Natural Disaster
- WEF Global Risk Report 2020
- https://ourworldindata.org/co2-and-other-greenhouse-gas-emissions