
Mapping the effect of climate change on polar glaciers and permafrost has become an essential scientific discovery, which today shows a glimpse of some of the most dramatic changes on Earth. When the planet is heated at a unique speed, snow and frozen land that define the Arctic and Antarctic landscapes, not just planetary health, but also our collective future, who stands as a janitor? Mapping these changes requires innovation, technical mastery and integration of traditional scientific practice with state -of -the -art geospatial technology.
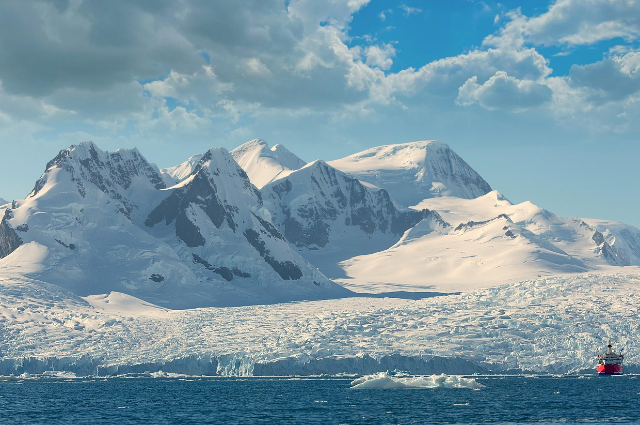
Research at the core of polar climate change says that glaciers, glaciers, and rivers of old ice quickly retreat, the rivers flowing from the sea from the ice cap. For example, the dramatic shrinkage of Greenland’s Jakobshavn Glacier, which once went on to a record speed, has now moved to a period of rapid return, after losing ice every year. Satellite data collected by NASA’s Grace (Gravity Recovery and Climate Experiment) and ICESAT-2 (ICE, Cloud and Land Elevation satellite) have enabled researchers to “weight” and monitor these glaciers with millimeter accuracy from the track. By changing the height of the surface over time, researchers can not only map the lost area, but it is also important for calculating volume and mass, and contributions to global sea levels.
The field research satellite increases the observation, often in extreme, isolated places where researchers rely on GPS and GNSS (Global Navigation Satellite System), a receiver attached to glacier surfaces. These devices measure microscopic movements – sometimes a few centimeters in a year – the speed of the flow of the glacier, and sudden pulses are known as “glaciers”. A combination of space-based altimetry and ground-level GPS surveys allows episodes to melt in high-resolution mapping of ice-breaks, changes in the accumulation of ice, and changes in atmospheric circulation to increase the temperature.
But the effect of climate change in polar regions is outside the visible face of glaciers. These areas are known as permafrost, and the surroundings also go through rapid changes. Permafrost is frozen soil, rock, and organic materials that trap the huge amounts of carbon under the earth’s surface for millennia. Like – when the global temperature rises, permafrost begins to melt, destabilizes the ground, and releases greenhouse gases – carbon dioxide and methane – in the atmosphere. This is a reaction loop; In the form of more permafrost, several greenhouse gases are released, which further accelerates the heating.
Survey of Permafrost thaw is a challenging task, which is possible with the synergy of satellite remote measurement, air examination, and on-the-Grounds. Synthetic aperture radar (SAR) from satellites from the European Space Agency -1 peers to detect minor changes on the surface of the ground through peers through peers and darkness through clouds and darkness, such as a recession and rebel permafrost. Landlords generally observe normal changes in the permafrost landscape. Unmanned air vehicles (UAVs) or drones have revolutionized permafrost mapping, flying at low altitude to create a high-resolution digital elevation model (DEM), which catches melts as thermokarst, such as snowfalls.
Examples of real life highlight the local effects of this melting. In the town of Alaska, Newtok, the entire neighborhood is forced to move due to a clamping, which reduces the basis for the construction of Permafrost, leading the roads to a deer, making the country a frequent land into a wetland. Similarly, the Russian city of Norilsk is suffering from periodic disturbance in the form of violent induced ground-under-housing damage to pipelines and infrastructure. Detailed geophysical mapping in these places not only tracks physical changes; This informs urban planners, engineers, and emergency leaders that the North has been tasked with adapting to new risks.
Technically, climate scientists use a geophysical tool kit that blends radar, LiDAR, infrared imaging, and measurements in a seine. Light detection and range (Lidar) map helps the surface height of the glacier and permafrost topography with centimeter-scale accuracy, even in inaccessible places. The resulting datasets live in the geographical information system (GIS), which produces layered maps that blend the top of top cheese, basic distribution, and methane emissions. For example, scientists combine satellite temperature registrations with ground-based methane sensors in Siberia to map “hotspots”, where permafrost has fallen into Thermokarst lakes and bubbled with powerful greenhouse gases.
Data integration and long-term monitoring are important for understanding trends and predicting future changes. Continuous satellite chain allows for animation of glacier retreat and permafrost fall – visualizations that find their way in rapid climate policy forums and education campaigns. For example, the Polar Geospatial Center at the University of Minnesota, the dynamic maps of the Glacier movement and Circulator North compile to the dynamic maps over permafrost changes in the north compile to air and satellite images. Researchers and decision makers can “zoom in” on a single society or river valley to assess today’s dangers and follow future landscapes under different heating paths.
In addition to their scientific significance, changes in glaciers and permafrost have cultural and moral resonance. For Arctic indigenous peoples, this country has taken knowledge and tradition for centuries. Local observations often complement high-technical mapping projects, with significant, grassroots-sensory data, new cracks or unpredictable synchronies on seasonal changes with predators and deer flocks. This integration of traditional ecological knowledge with modern geopolitical mapping enriches scientific items and technical conclusions in living experiences.
Looking forward, the speed and resolution of climate map technology will only accelerate. With small constellations of CubeSat and earth observation satellites, drones self-arms, and advanced machine learning algorithms, sometimes rich and more frequent comments from the polar landscape are distributed. Portable methane sensors and strong fields -GNSS units become a standard edition for climate application teams, ensuring that the significant ground data reveals what satellites reveal from above. High Demonstrations Computing and Data Visualization Platforms now allow researchers and decision makers to interact with time -chain sets in real time, gradually replace stable maps with dynamic, dynamic changes, dynamic change, online "Living Atlas".
. . .
References: