
India ranks second-lowest among 177 countries in the Environmental Performance Index (EPI) rankings released this year. Yale University ranked India 176th, just ahead of Laos, in a global metric based on environmental health and ecosystem vitality. India stood last among the 8 South Asian countries.
Meanwhile, the top positions are held by European nations, with Estonia at the top due to its reduction in fossil fuel production, switch to renewable electricity, and decrease in greenhouse gas emissions. Outside Europe, Japan ranks 16th in the world, Australia 25th, the United States 27th, and Canada 29th. Among the developing economies, Brazil leads at 50th, Russia at 89th, South Africa at 111th and China at 129th.
What is EPI?
The global Environmental Performance Index is put together by scientists from Yale and Columbia Universities biannually. Data is compiled from several sources on several indicators and specific issue categories under policy objectives, for each country. One policy objective is environmental health, which includes issue categories such as air quality and indicators such as ambient fine particulate matter levels. The second policy objective is ecosystem vitality, which reflects the management of natural resources by each country. It includes indicators such as tree cover loss, pesticide pollution risks and marine habitat protection. The third policy objective is climate change mitigation, which includes indicators such as carbon dioxide and methane emissions. All of these are accounted for to provide each country with an overall EPI score from 0 to 100; the higher the score, the better the performance in comparison to its peers.
For the EPI 2026 report, the team ranked 177 countries on 47 environmental indicators across 12 issue categories in three policy objectives. Environmental health made up 25% of the total score, ecosystem vitality contributed 45% of the total score, and climate change made up 30% of the total score. This year, EPI added a grassland indicator built with data from the Global Pasture Watch research consortium, led by Land & Carbon Lab. Grasslands cover 40% of the ice-free surface of Earth, supporting biological diversity, sequestering carbon dioxide and sustaining livelihoods, which makes this addition relevant.
The findings in this report show a correlation between wealth and high performance in EPI, as they can afford expenditures on environmental infrastructure. The outperformance of some nations can also be attributed to outsourcing of dirty industries to the Global South.
India’s performance
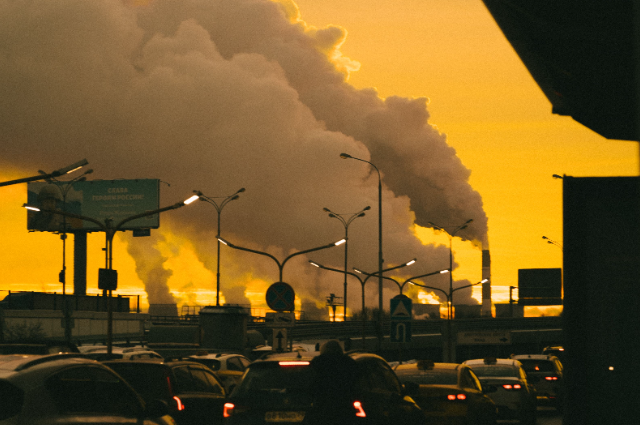
India has a total EPI score of 22.46, ranking 174th in environmental health, 171st in ecosystem vitality and 130th in climate change policies. India fared poorly in air quality indicators (-0.15), such as the burden of death and disease from exposure to fine particulate matter, carbon dioxide and sulphur dioxide, which showed a negative value across the decade. This time, Marine Protected Area effectiveness was extremely low and negative (-51.77). The Regional Marine Trophic Index shows a negative change in the score (-10.27).
The report noted, “India, whose per-capita emissions remain relatively low but are growing rapidly, faces an acute development-versus-pollution tension as hundreds of millions of people gain access to modern energy services but at the price of serious urban air pollution and spiking GHG emissions.”
The researchers also state that India’s weak performance reflects critical air quality problems, reliance on coal-fired power and lack of biodiversity protections. Zachary Wendling, Research Director for EPI at the Yale Centre for Environmental Law and Policy, said that resorting to catching fish further down the food chain indicates overfished fish stocks at the top of the food chain, as interpreted through the negative Regional Marine Trophic Index. Alternatively, fishing of lower-level species is more profitable than higher-level scarce ones.
Improvement over the past ten years
Despite India’s low EPI score, its ten-year change remained positive at 7.47, higher than a few high-ranked countries. This is because, overall, applying EPI’s current methods to historical data shows that India's performance has increased over time, according to Wendling. While emissions remain high, the rate of increase of some compounds, ds including air pollutants, has slowed.
He said, “While emissions of carbon dioxide and some other greenhouse gases are still too high and rising, they are not rising as quickly as they have in the past.”
Past dismissal of the methodologies
When, in 2022, EPI listed India at the lowest rank, 180, the Union Environment Ministry said that it does not accept the analysis and conclusions for several reasons, and the Index is based on “surmises and unscientific methods” in a press release. The Government listed several concerns regarding methodology and not accounting for historical data on its low emissions. The EPI lead had responded earlier that rankings consider current environmental conditions and not historical emissions or policy intent. EPI also expressed the intent to collaborate with the Ministry as it improves its analysis methodologies in future.
Also, in the past six years, the methodologies have been unstable in the EPI reports. In 2022, the performance indicators were 40; in 2024 they were 58, and this year there are 47.
The need of the hour
The EPI methodology has limitations such as changes in indicators with every edition, making year-wise comparisons difficult. It does not account for historical responsibility, as India raised back in 2022, which is a valid scientific and diplomatic objection. The Index might be imperfect, but outrightly disregarding the Index does not seem sensible, as data from Indian sources also indicates substandard condition of environmental resources and an exploited state of ecosystems.
Improvement in air quality requires proper monitoring and industrial accountability along with switching to renewable energy sources. Ecosystems, including marine, forest, and grasslands,nds need to be protected on the ground rather than mere laws. Environmental data points need to be stored to build a reliable database in order to monitor government policies and global rankings.
References:
- The Wire
- Environmental Performance Index
- The Pioneer