
Abstract:
The main aim of this paper was to figure out if the method of technical analysis is profitable or not, keeping in mind the various constraints & problems it carries along. The paper has utilized the Indian Stock Market specifically the index i.e., NIFTY 50 and various stocks under the National Stock Exchange (NSE) as a medium to conduct the study and arrive at a conclusion relating to the same.
Historical data analysis has been carried out for the past years and the respective data has been used as a reference point for the conduct of the analysis as a part of this research study. Various tools such as Candlestick Patterns, Price Action Patterns, Major Indicators, and the basic rules & principles of Technical Analysis have been utilized for the study.
Introduction
Technical Analysis is the process of forecasting and predicting the future prices based on past price movements. Technical analysis does not relate a method of predicting future prices, but it involves the analysis of current demand & supply of stocks, indices, futures, or commodities.
The basic principles upon which Technical Analysis functions can be found below -
Price & Markets discount everything:
Technical analysis runs on the principle that the current market price (CMP) fully reflects all the significant material facts which could affect the price of a security. The current market price (CMP) reflects the sum knowledge of all participants, namely retail traders/investors, portfolio management houses, professional analysts, market strategists, fundamental analysts and such other participants.
Prices move in trends:
Technical analysis is based on the principle of trend following. Most technical analysts are aware that several years and decades of stock charts have shown us one basic understanding – prices move in trends. If prices moved in random directions, it would be extremely difficult to be profitable using technical analysis. An analyst believes that it is possible to identify a trend, invest or trade based on the trend.
What is more important than why:
It is a very well known fact that the value of any product, thing or asset is only what the person is willing to pay for it. There is no such requirement to determine the question of why he/she would be willing to pay for it. By directing the attention towards the price and nothing else, technical analysis utilizes a more direct approach. The price is the result between supply and demand namely the confrontation among buyers & sellers for any tradeable security.
Objectives of the Research
- To educate the public about technical analysis
- To determine if technical analysis is profitable
- To test out the strategy of price action combined with candlesticks & indicators in the stock market
Review of Literature
- Cheol-Ho Park and Scott H. Irwin “The Profitability of Technical Analysis: A Review” examines the evidence on the profitability of technical analysis in a much-detailed manner using various trading strategies & studies like RSI, Moving Average Crossover, and Alexander’s Filter Rule. The research paper explained various other models and studies in the world of technical analysis. The conclusion brings about a state of confusion with mixes reaction owing to various models and studies being analyzed as a part of the research.
- Ben R. Marshall, Rochester H. Cahan, Jared M. Cahan “Technical Analysis Around the World” states that there are over 5000 trading rules around the world and that all of them are not profitable in all the indices of 49 countries. The research brings about the point that each market has certain trading rules which are successful once used in isolation. Also, the research states that technical analysis performs better in emerging markets. The conclusion of the research states that over 5000 trading rules do not add value but they do seem to compliment other investment techniques.
- Ben R. Marshall, Martin R. Younga, Lawrence C. Rose “Market Timing with Candlestick Technical Analysis” examines the profitability of timing the market entry with the use of candlestick patterns. This research largely relates to the US Stock Market. The research concludes that basing trading decisions solely on candlestick patterns is not the right decision since they only compliment other techniques of trading.
- Fotis Papailias, Dimitrios D. Thomakos “An Improved Moving Average Technical Trading Rule” examines a different version of the typical moving average crossover technique of trading & technical analysis. Under this method, the cumulative returns and the Sharpe ratio are significantly increased.
- Carol Osler “Support for Resistance: Technical Analysis and Intraday Exchange Rates” examines the popular support & resistance levels used in technical analysis and their profitability/success rate. They are typically turning points in the trading prices. The research compared support & resistance to trading ranges and came up with the conclusion that S&R is similar but not exactly the same as trading ranges.
Research Methodology
The basic method of this research revolves around the utilization of several technical tools namely price trends, price action patterns, candlestick patterns and indicators
- Price Trends: A trend can be defined as the direction in which the market moves. Generally, trends are recognized with the usage of tools like trendlines or price action that help determine if the price is making higher highs and higher lows for an uptrend, or lower lows and lower highs for a downtrend.
- Candlestick Patterns: Candlestick charts provide visual insights to the current market conditions. A candlestick displays the open, high, low, and closing prices in a manner as to explaining the association between the opening and closing prices. They don’t involve any calculations or mathematical formulas. Each candlestick represents one period of data (depending upon the timeframe of analysis).
- Price Action: Price action is the way in which the prices of securities react to certain patterns formed over a period of time evident in the charts. Price action is the foundation of all the technical analysis of any tradeable security. Several traders rely solely on price action and the formation of such patterns to trade & make money appropriately.
- Indicators: Technical Indicators serve various functions which involve alerting and confirming the trading decisions taken up. Indicator acts as an alert to price action patterns, such as the break of S&R levels. A positive RSI divergence can act as an alert to watch for a resistance breakout. Indicators can be used to confirm other pattern breakouts.
A good trading strategy involves the utilization of all these four tools namely price trends, candlestick charts, price action patterns and indicators.
An example trading strategy is as follows –
- Price Action Patterns: Breakout of Ascending Triangle, Descending Triangle, Symmetrical Triangle, Falling Wedge, and Descending Channel.
- Candlestick Patterns: Candlestick Patterns may/may not be used for the purpose of confirmation. Some of them involve Bullish & Bearish Engulfing, Hammer, Shooting Star, Morning Star, and Evening Star
- Price Trends: Continuation Trading with Bullish Trend i.e., higher highs & higher lows
- Indicators: Indicators act as confirmation tools. Some of them include – RSI, Moving Averages and Volume
Research Findings
This particular research involves the utilization of a single strategy involving the use of the following tools –
- Breakout Trading of Price Action Patterns like Ascending Triangle, Descending Triangle, Symmetrical Triangle, Falling Wedge, Descending Channel and Ascending Channel.
- Indicator Confirmations with 50 & 200 Exponential Moving Averages, Volume Analysis, and Relative Strength Index (RSI)
- Time Frame - Daily
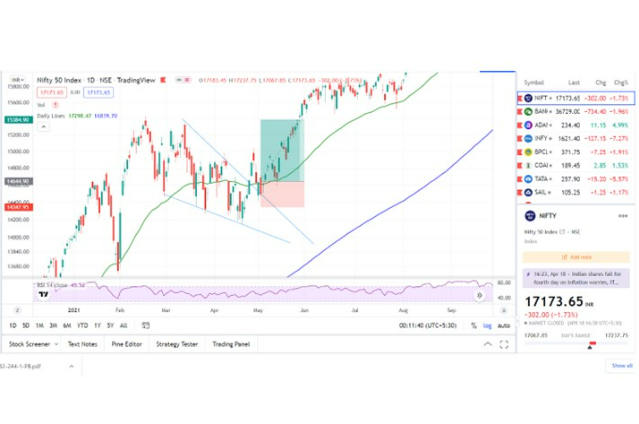
The following is an example of an executed trade in the index of NIFTY. Herein, there is a formation of a Falling Wedge Price Action Pattern on the daily time frame. We can also confirm this trade with the help of breakout of 50 Exponential Moving Average over the positive indication of the index trading well above 200 Exponential Moving Average. Finally, the Relative Strength Index seems to have crossed 50 while staying below the overbought zone of 70.
Hence, these were some of the key indications of a buy trade.
But the work does not stop with looking for trades on the basis of technical analysis alone. Trading also involves the usage of Risk Management, Emotional Intelligence and Patience.
As we can see in the above chart, a significant and well-established stop loss is set below the previous swing low to protect the capital from potential losses and to restrict loss of capital.
With the execution of all the instructions as per the trading strategy set along with patience and emotional confidence resulted in a profitable trade as demonstrated above.
Well, this can obviously be a lucky win as for the reason because it is just a single trade. Hence, the picture of back testing comes into play.
For those of you who are wondering what back testing is. Back testing is basically the method of seeing how a particular trading strategy would have played out in the history of the markets. This can typically be done by using historical candlestick charts and applying the strategy to the same. In case, back testing seems to succeed, traders can employ the strategy in real time trading.
Here are the findings from back testing employed by the researcher –
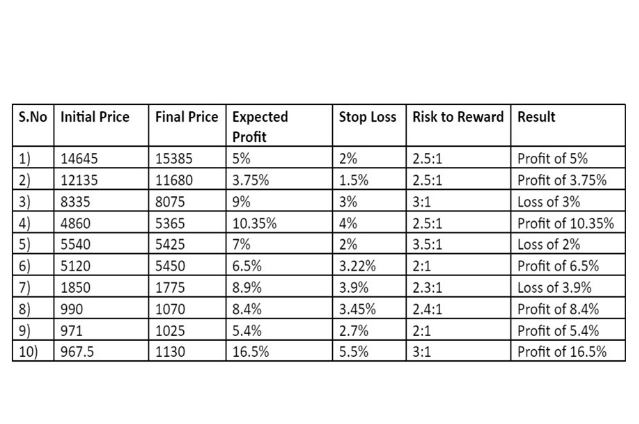
The following was the data obtained from the candlestick charts of the index ‘NIFTY 50’.
The implications which can be made are as follows –
- Overall Success Rate of 70%
- Risk to Reward averaged around 2.5:1
- The Profitability ratio is much higher and thus the strategy can be declared a successful one to be implemented in real time trading
Conclusion & Suggestions
The major takeaway from the research stands to be the point of profitability of technical analysis being proven in the index ‘NIFTY 50’.
As stated in the research findings, the strategy followed by the researcher seems to have attracted a profitability rate of 70% out of the 10 trades tested.
To emphasize on the point that technical analysis alone would not do justice to your trading strategy. The best suggestion would be to combine technical analysis with skills like Risk Management, Emotional Intelligence, and Self-Confidence/Patience on the trading strategy.
To add to this point would be a typical disclaimer: Please follow your own research as these findings are specific to the researchers’ point of view and hence any trading decision taken should be specific to the participant’s risk capability and technical ability.
. . .
Bibliography:
- www.investopedia.com
- www.tradingsetupsreview.com
- en.wikipedia.org/wiki/Candlestick_chart
- samuraitradingacademy.com
- in.tradingview.com
- en.wikipedia.org/wiki/Backtesting
- www.investopedia.com
- www.nseindia.com/
- www.fidelity.com/learning-center
- www.ig.com/en/trading-strategies
- corporatefinanceinstitute.com/resources
- school.stockcharts.com
- zerodha.com/varsity/chapter
- choiceindia.com/blog/volume-in-stock-market